
I wanted to get a read on historical levels of lead poisoning of children in Flint, Michigan, so I put together the chart on the right. There’s no consistent data available for the entire 20-year period, but I think I made fairly reasonable extrapolations from the data available.1 What you see is very steady and impressive progress from 1998 to 2013, with the number of children showing elevated blood lead levels (above 5 micrograms per deciliter) 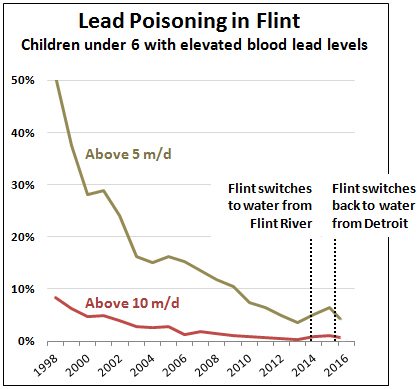 declining from approximately 50 percent to 3.6 percent.
Then Flint stopped using Detroit water and switched to Flint River water, which corroded the scale on their lead pipes and allowed lead to leach into the water. The number of children with elevated lead levels rose to 5.1 percent and then 6.4 percent.
In late 2015, Flint switched back to Detroit water. Preliminary testing suggests that this had a beneficial effect: the number of children with elevated lead levels dropped back to 3.0 percent. However, these numbers are still very tentative, so take them with a grain of salt.
UPDATE: I’ve added a line that shows the percentage of children with lead levels above 10 m/d. I wouldn’t want my kids to have anything above 5 m/d, but 10 is where things really start to get scary.
1Here are my data sources and extrapolations. For early years, only data for children above 10 m/d was available, but later years showed both 10 m/d and 5 m/d, which suggests a rough factor of 6x between the two. Also, some years only show data for Genesee County, but other years show both Genesee and Flint, which suggests that Flint levels are about 1.6x higher than Genesee.
- 1998-2000: From Michigan Department of Health & Human Services chart here, extrapolated from Michigan —> Flint (factor = 0.87) and 10 m/d —> 5 m/d (factor = 6x)
- 2001-2004: From 2005 MDHHS report here, page 54, extrapolated from 10 m/d —> 5 m/d
- 2005-13: From MDHHS data here.
- 2014: From Hurley Medical center data here, adjusted for Genesee —> Flint (factor = 1.6)
- 2015: From Hurley Medical center data here, slides 10-11, adjusted for Genesee —> Flint.
- 2016: From preliminary MDHHS data for post-switch levels here.
Full spreadsheet here.