This story was originally published in The Atlantic and is republished here as part of the Climate Desk collaboration.
A massive storm is barreling across the eastern half of the United States. Right now, it’s dropping ice and havoc over the southeast. Power outages in some areas of Georgia could last for weeks.
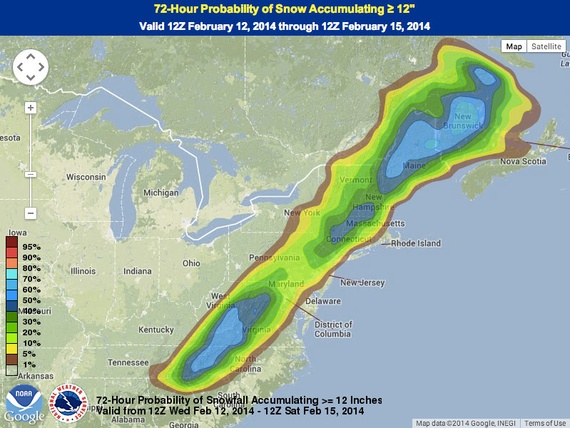
Soon, the same storm could drop more than a foot of snow over the Appalachian Mountains with smaller (but still large!) amounts all the way to the coast.
Storm models show that the storm might hit heaviest on the Outer Banks of North Carolina as the storm plows up the whole coast through Thursday and Friday.
If you live east of Ohio, basically, you want to keep your eyes on this storm. But how should you do it? It seems that there’s more weather information available to an average citizen than military planners would have had during the Cold War.
Here are some ways to go beyond the weather headlines. (Recently, I created a guide to going deeper into weather news, from which I’ve drawn substantially here.)
First, if you want to go deep with your weather dashboard, head to Weatherspark.com. It lets you dive into all kinds of data in a clean interface.
Next, you’ll want to follow the right people and institutions:
Meteorologist Jeff Masters is talking about the ice that’s hitting Georgia as I write. “Today’s ice storm is likely to be more damaging than the January 2000 ice storm, which caused $48 million in losses in north Georgia,” he says. “However, it will not compare to the damage from the most expensive ice storm in US history, the great February 1994 Southeast US ice storm. That storm killed nine people and caused $4.7 billion (2013 dollars) of damage.”
So is Eric Holthaus, who has some sad possibilites in his post on the storm, including that Atlanta could lose one-quarter of its trees.
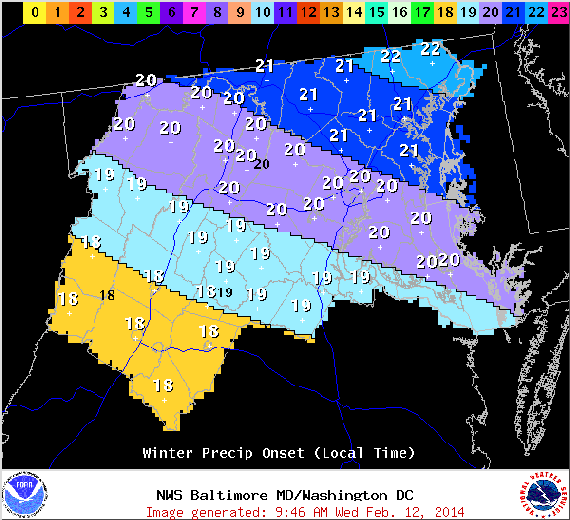
The Capital Weather Gang is liveblogging the storm. If you live in the mid-Atlantic, they’ll be indispensable. For example, here they show you the predictions for the storm’s start time (in military format, e.g. 20 is 8pm).
If you’re a New Yorker—but anywhere really—make sure you’re following the National Weather Service Twitter account for your area.
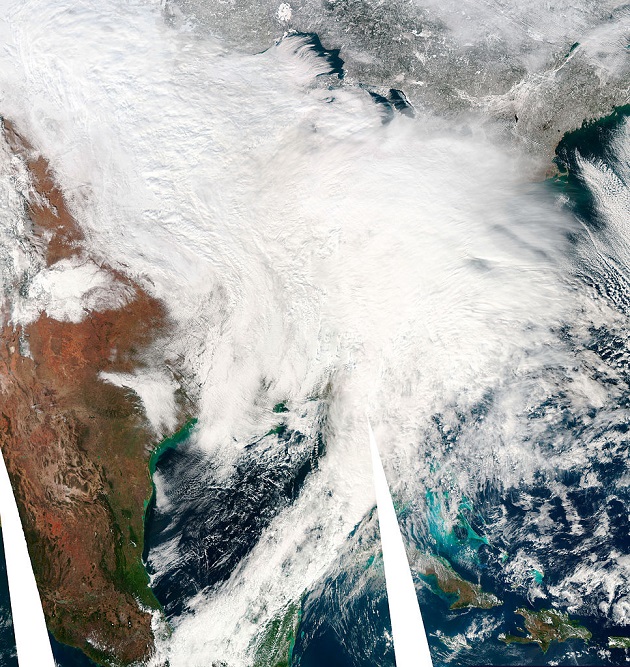
If you’re not satisfied with the filtered information that you’re getting from these institutions and your local meteorologists, you can get your hands on the data yourself by going to the National Oceanic and Atmospheric Administration.
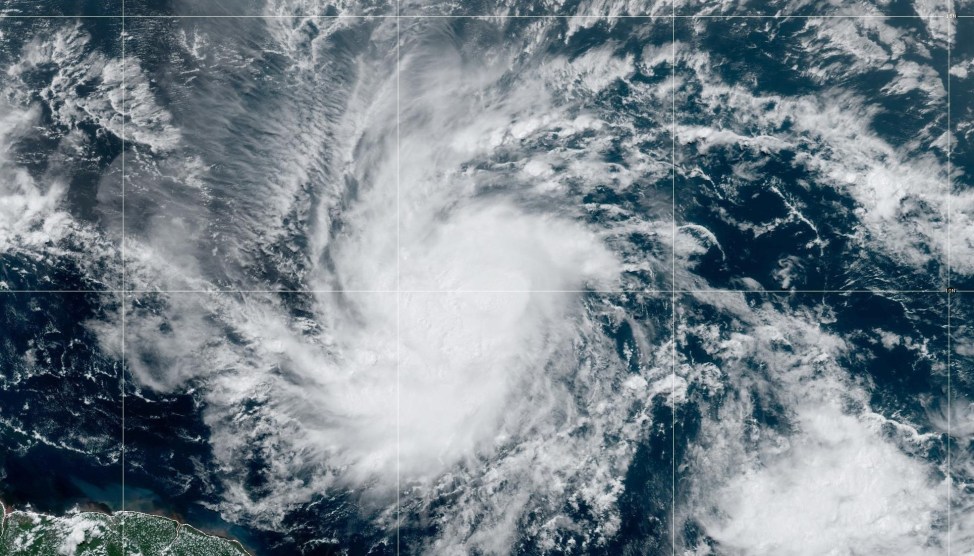
There you can get satellite imagery, like this loop in the infrared part of the spectrum for the past 24 hours. Note the red in the southeast.
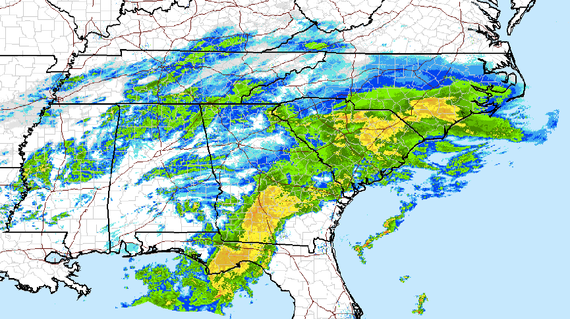
You can also find national radar maps.
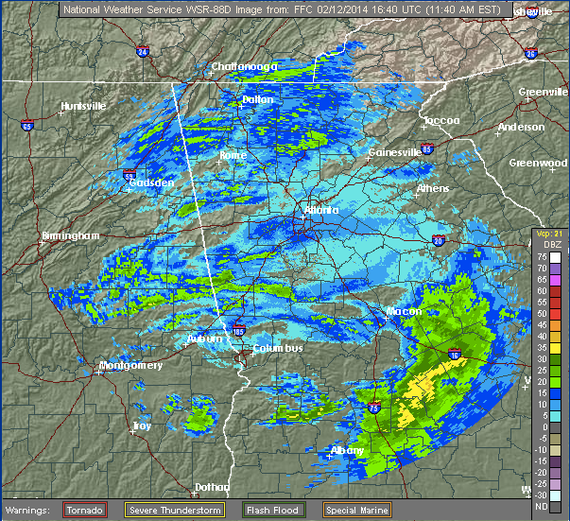
Or zoom in on a specific region, like, say, Atlanta.
Finally, if you really want to go deep, you can look at the various model predictions. Here, you can watch the precipitation totals bloom over the next two days in the standard NOAA Global Forecasting System.
But you can also compare between the models, if you’re a nerd who is so inclined. So, here you could run the same 48 precipitation prediction with the North American Mesoscale Model. Or you can look at the Global Ensemble Forecast Model, which brings together 20 different ways of predicting the weather.
If you’re really interested in this stuff, the Weather Underground has a nice (relatively) simple tool that lets you compare the different forecasts. Here, for example, is the model output for the GFS and NAM models looking at whether it will be snowing, raining, or otherwise precipitating at 7 a.m. on Thursday.
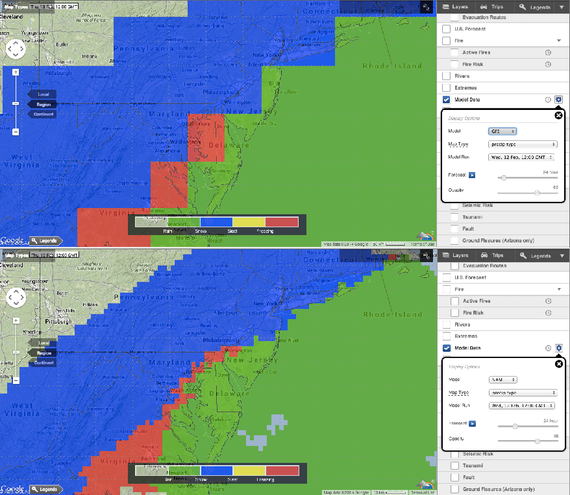
One can see how comparing these two charts might be useful if you live on the south side of Philadelphia. The GFS shows the area solidly in snow (blue) while the other model has freezing rain (red) encroaching on the region. Of course, they also show how difficult weather prediction is, and why there are always uncertainties about the particulars of any given weather event.