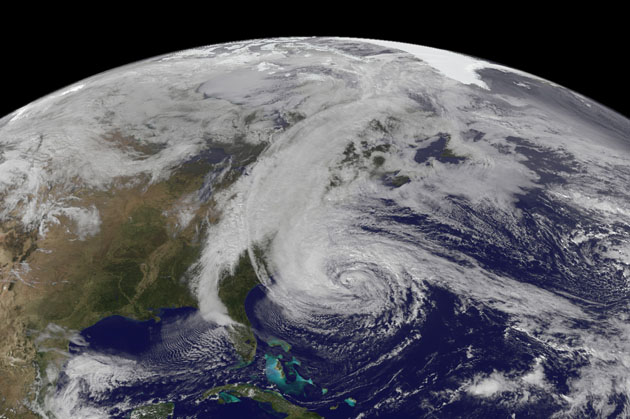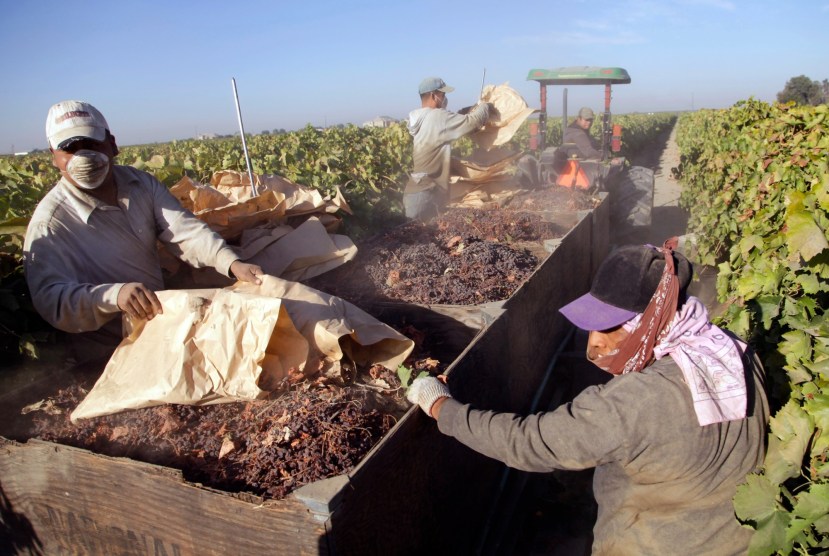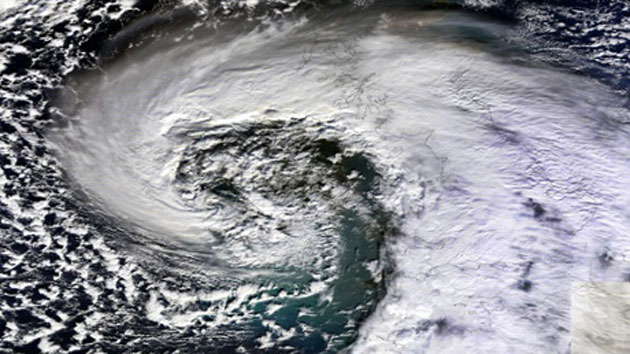
A weather front swirls over the UK on 12 February 2014, one of a succession of storms that led to widespread flooding.NASA/MODIS
This story originally appeared in the Guardian and is republished here as part of the Climate Desk collaboration.
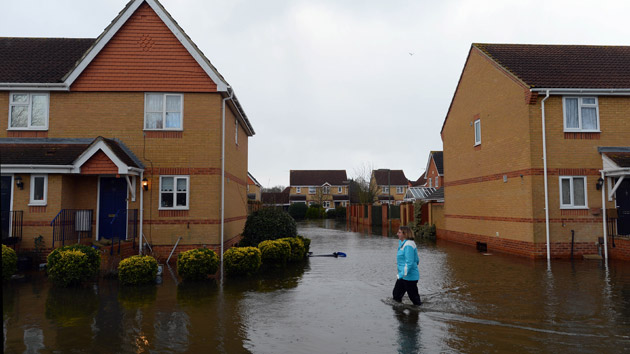
“You can’t link climate change to specific weather events.” That is the accepted wisdom that has been trotted out repeatedly as the wettest winter in at least 250 years battered England and Wales. But the accepted wisdom is wrong: It is perfectly possible to make that link and, as of today, you can play a part in doing so.
A new citizen science project launched by climate researchers at the University of Oxford will determine in the next month or so whether global warming made this winter’s extreme deluge more likely to occur, or not. You can sign up here.
The weather@home project allows you to donate your spare computer time in return for helping turn speculation over the role of climate change in extreme weather into statistical fact. That debate has been reignited by the devastating winter weather and the flooding and storm damage it wrought (more on that debate here).
The research that links global warming to particular extreme weather events is called attribution and has already notched up notable successes. The Oxford team showed in 2011 that climate change was loading the extreme-weather dice as far back as 2000, in a study that showed serious flooding in England that year was made two to three times more likely by man-made greenhouse gas emissions. The killer heat waves in Europe in 2003 and 2010 were also made far more likely by global warming, similar research has demonstrated, while another new study shows how Hurricane Katrina would have been far less devastating had it happened 100 years ago.
The attribution studies work by taking a period of time in which an extreme weather event occurred and rerunning it many thousands of times in climate models. One set of models starts with the actual real-world conditions—i.e., with high levels of atmospheric greenhouse gases—and reveals how frequently the extreme event occurs. Another set of models starts with atmospheric and ocean conditions that would have existed without the carbon emissions pumped into the air by human activities and therefore shows how frequently the extreme event occurs would occur in an unwarmed world.
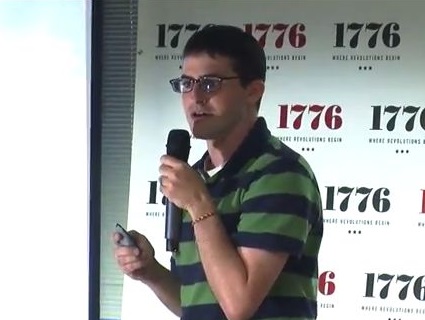
Comparing the frequency of the extreme event in each set of models gives a measure of how heavily global warming has loaded the extreme-weather dice—or not. The models have to be run many thousands of times because the extreme events being studied are, by definition, rare. Many repetitions are required to generate robust statistics, and that’s why they need your computer time: It’s a huge computing task. Nathalie Schaller, a member of the Oxford team, explains the experiment further in this video:
The researchers do not know what the result of this new experiment will be, and they will post the results of the computer model runs as they come in, on their site and this blog. The science will unfold live before your eyes, and theirs, at the same time.
They estimate that a total of roughly 30,000 reruns of the English winter of 2013-14 will be needed to reach a definitive conclusion. That should take a month, depending on how many people sign up.
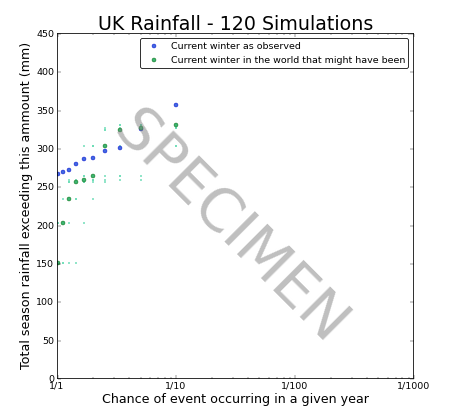
To give you a sense of what the results will look like, the team have generated some illustrative graphs, based on previous data but not pertaining to the new experiment. The plots show the chance of the total winter rainfall exceeding 450 millimeters in a particular year (the winter of 2013-14 saw 435 mm fall on England and Wales, the highest in records dating back to 1766).
Each rerun winter is represented by a dot, with blue dots coming from the set representing the real-world conditions and green dots coming from the set representing the modeled world without climate change. If the blue dots plot above the green dots, then climate change has made that event more likely, and vice versa. If the dots plot in the same place, then climate change has not affected the chances of that event happening.
In the plot below, containing just 120 simulations of the winter, it is hard to discern any convincing trend. That is because when examining extreme events, many simulations are needed to generate a robust result.
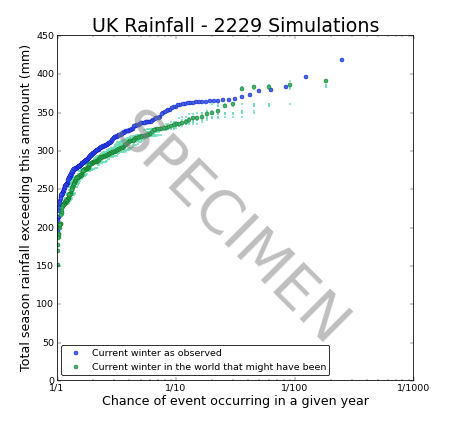
But in the following plot, with over 2000 simulations, the trend is much clearer. The new experiment is likely to need 5,000 reruns of the winter under real-world conditions and 24,000 reruns of the winter as it would have occurred in world without climate change.
Predicting the impacts of climate change rightly takes up much of the time of climate change researchers, but this use of climate models reveals the extent to which climate change ands extreme weather is a danger right here, right now.
It is rare that anyone with a computer can participate in cutting-edge scientific research, particularly on such a relevant and important topic, but the weather@home project presents that opportunity. The Oxford team would be grateful if you took it.