
Will Wilkinson is unimpressed with Tim Noah’s recent series on growing income inequality. He cites several recent pieces of research to suggest that, in fact, inequality hasn’t been growing as fast as we think:
Robert Gordon, an economist from Northwestern University….reports that improved use of income datasets “shows that there was no increase of inequality after 1993 in the bottom 99 percent of the population, and can be entirely explained by the behavior of income in the top 1 percent.”….Christian Broda and John Romalis find that “the relative prices of low-quality products that are consumed disproportionately by low-income consumers have been falling over this period. This fact implies that measured against the prices of products that poorer consumers actually buy, their ‘real’ incomes have been rising steadily.”….Using an updated price index, Christian Broda, Ephraim Leibtag, and David Weinstein find that the real wages at the 10th percentile increased by 30 percent from 1979 to 2005.
There’s long been a cottage industry in efforts to show that income inequality isn’t as bad as the raw numbers say it is. Until recently, the most popular tactic was to insist that we should look at consumption instead of income. This was mostly just an attempt at misdirection, but in any case the great credit bubble and bust has made it plain that a lot of recent middle class consumption was fueled by refi and charge card binges that ended disastrously. If anything, this strengthens the case of those who say that income matters after all, so we don’t hear this argument much anymore.
But there are plenty of others. We’re measuring inflation wrong. Cheap plasma TVs and Chicken McNuggets have made the life of the poor better than you’d think by just looking at their earnings. The whole thing is just a statistical artifact of the 1986 tax reform bill. The composition of households has changed, so household income goes farther than it used to. Income distribution looks better if you count government transfers. Etc. etc. etc.
There are bits and pieces of truth to some of these things, but for the most part they don’t really address income inequality at all. They just move the spotlight to something else. Are households smaller than before? Yes, which is why I usually prefer to look at 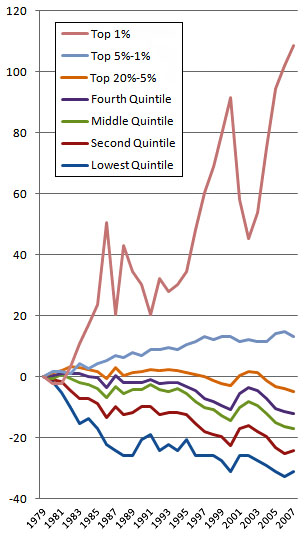 statistics for individuals. Have consumption patterns changed? Maybe so, and taking that into account in an effort to get a handle on the actual lived experience of the poor/working/middle classes is an interesting exercise. Is CPI the right inflation measure? I prefer it, but it’s an arguable point.
But regardless of the answers to all these questions, there’s still the raw fact that the flow of money in America has changed dramatically over the past few decades. That’s why one of my favorite charts is the one on the right. It’s updated from the older version that I posted a couple of days ago, and the data comes from an annual CBO report that shows the share of total earnings going to various income levels.
It’s not perfect, but it’s pretty good. Since it shows income shares, inflation measures don’t matter. It doesn’t try to measure consumption, it just measures who the money is going to. It includes pensions and government transfers. It accounts for reporting changes due to the 1986 tax reform bill. And it uses tax data to get a cleaner look at the top of the income distribution.
(Drawbacks: It doesn’t include healthcare benefits, which would change the shape of the curves slightly. And it uses households as its unit of account. That’s not the way I like to look at things, but it’s pretty standard in the field.)
If you look at the raw CBO figures, they show that a full tenth of the national income has shifted since 1979 to the top 1% of the country. The bottom quintiles have each given up a bit more than two percentage points each, and that adds up to 10% of all earnings. That 10% has flowed almost entirely to the very tippy top of the income ladder.
Is the middle class worse off because of this? Of course they are. Income matters even if plasma TVs are cheaper than they used to be or if CPI mismeasures middle class consumption or if average households now contain 2.6 members instead of 2.7. If this massive income shift hadn’t happened, middle class earnings would be higher, they’d be able to buy more stuff, and they probably wouldn’t be in debt as much. And the top 1% wouldn’t have quite so much idle cash lying around to do stupid things with.
This income shift is real. We can debate its effects all day long, but it’s real. The super rich have a much bigger piece of the pie than they used to, and that means a smaller piece of the pie for all the rest of us. You can decide for yourself if you think this is something we should just shrug our shoulders about and accept.