
A few weeks ago I mentioned that the Census Bureau planned to release a new report that would assess poverty using a newer and more comprehensive measure. The “official” poverty threshold dates back to 1964 and was very simple: it was calculated as the cost of a minimally adequate diet multiplied by three. The new measure is more complex and takes into account both government benefits (EITC, SNAP, housing subsidies, etc.) and higher costs in some areas (payroll taxes, medical bills, etc.).
The bottom line is simple: using the new formula, more people are in poverty than we thought. By age, there are fewer kids living in poverty, more adults living in poverty, and a lot more seniors living in poverty. Unfortunately, this is only moderately interesting. You can always make the threshold go up or down by fiddling with the formula a bit, so this doesn’t actually tell us that much. But assuming the new formula is a good one, what would be interesting is to see the trend over time. Has poverty gone up or down over the past 40 years? Over the last decade? Since the start of the Great Recession?
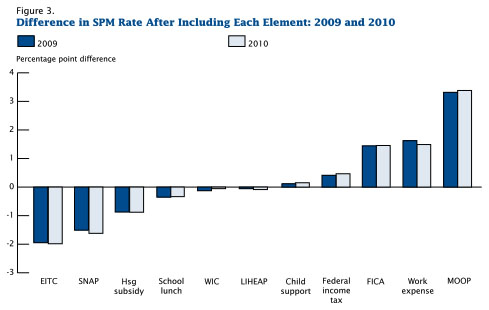
We don’t know because the report doesn’t tell us. Instead, I’ll leave you with this chart, which explains fairly well how the new formula works. It shows the effect of various elements of the formula on the poverty rate. For example, on the far left, when you account for the Earned Income Tax Credit the poverty rate goes down by two points. Accounting for SNAP (food stamps) lowers the poverty rate about 1.5 points. On the far right, when you account for the rise in Medical Out of Pocket costs, the poverty rate goes up by more than three points. (Since seniors have high medical bills and kids tend to have low ones, this goes a long way toward explaining why fewer kids are in poverty and more seniors are in poverty under the new formula.)
One other note: if you take this report seriously, it’s a pretty good argument against reducing Social Security benefits by fiddling with the official inflation calculation. Rising out-of-pocket costs are hitting seniors harder than most of us, which suggests that the official inflation rate understates the actual inflation rate faced by the elderly. Reducing it even further would be a substantial blow.
If you’re interested in diving into this in more detail, the whole report is here.