
In my post earlier today about NAEP test score trends, I said I was pessimistic about recent educational reforms because big gains among 9-year-olds mostly seem to wash away by the time students graduate from high school. However, several commenters complained that this was unfair: high school students in 2008 had spent only a few years in the post-NCLB “reform” environment. What we really want to look at are cohort effects. How do kids who have spent their entire lives in the new environment do?
First, some background. In my initial post I used data from the NAEP long-term assessment. This has two big advantages. First, the data goes back further. Second, the long-term test has stayed more stable over time, which makes it a better standard for trend comparisons. In contrast, the main NAEP test gets rewritten every decade or so.
However, the main test still has a pretty good reputation, and it also has the advantage of providing more recent data. We don’t have 2011 scores for high school students yet, but we do have 2011 reading and math scores for 4th and 8th graders. So here are test score improvements on the main test from 1992 through 2011:
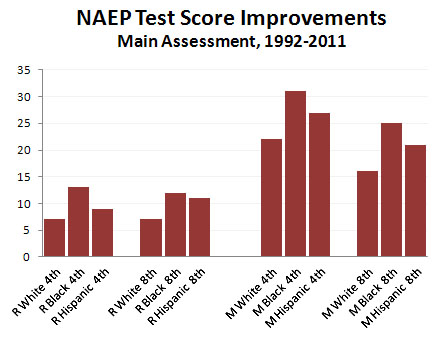
As usual, keep in mind the rule of thumb that a 10-point change on NAEP scores is about equal to one grade level.
This only goes through middle school, but it’s obviously more promising than the long-term data I posted earlier. The 4th grade gains in reading are considerably more modest than on the long-term assessment, but they persist through 8th grade. The gains in math are better than on the long-term assessment, and although some of the gains are lost by 8th grade, the dropoff isn’t huge. Note that the 1992 cohort of 8th graders is almost entirely pre-reform, even if you count state reforms that predate NCLB, while the 2011 cohort of 8th graders began first grade in 2003, so these are kids who have spent their entire school lives in post-reform schools. That makes this a pretty good comparison group.
Now, there are several caveats here:
- We still don’t know how high-school students are doing. We’ll need to wait until 2015 before we have a cohort of 12th graders who have spent their entire lives in post-reform schools.
- The data is from the main NAEP assessment. For longitudinal studies, I think the long-term assessment is probably superior.
- As usual, you have to decide for yourself if you think scores on standardized tests are really a good measure of student achievement.
Still, caveats aside, this data clearly supports a fairly optimistic view of how our schools are doing. Keep it in mind whenever you read a mournful op-ed about our failing educational system.