
Over at the motherblog, Kristina Rizga has an interesting piece about what happens when you try to integrate majority-black schools. Basically, nobody likes it. The poorer (mostly black) parents don’t like the idea of a bunch of rich folks coming in and pushing them around. The richer (mostly white) parents don’t like the idea of their kids going to a low-performing school. But Kristina points to a substantial body of research showing that, in fact, white kids do fine when they move to schools in poorer black neighborhoods. In fact, they might even do better on a variety of metrics.
The whole piece is worth a read, but because I’m a nerd I going to use it as an excuse for a statistics lesson. One of the links in the piece is to a recent report from the federal government about the black-white achievement gap. It contains three charts 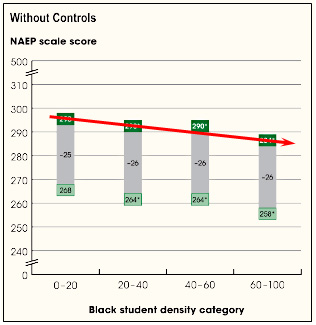 of note. The first is on the right, and it shows white test scores in schools with different densities of black students. Basically, it confirms the worst fears of white parents: as the percentage of black kids goes up, the test scores of the white kids go down.
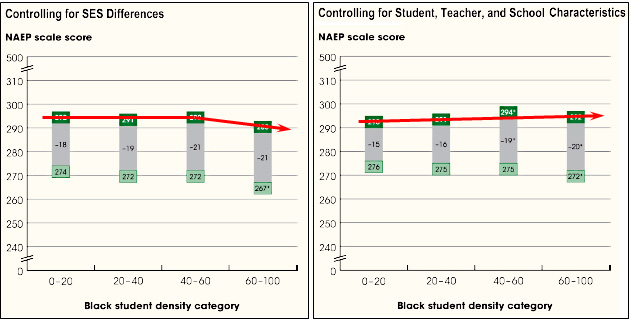
But wait. Maybe the white kids in majority-black districts are lower performing to begin with. So let’s control for income. That gets you the chart on the bottom left. Not so bad! Then let’s control for some other characteristics. Bingo! If we do a proper job of comparing apples to apples, white kids actually do better when they go to schools with very high densities of black students. White fears turn out to be entirely unfounded.
So here’s the question: which chart do you believe? The one with the raw data? Or the ones with all the fancy-pants statistical controls? Are the controls legitimate? Or are they just the result of a bunch of liberal analysts in the Department of Education torturing the data until they get the politically correct result they want?
Even statisticians might disagree about this. So how are laymen supposed to understand it? If you were a parent and these were your kids we were talking about, which chart would you believe?