
How are our big cities doing when it comes to educating their students? It’s easy to look at overall test scores, but that doesn’t tell you much. In general, whites score better than Hispanics and Hispanics score better than blacks on the “gold standard” NAEP test. This means that some cities will do better or worse than others depending on how many kids of different racial groups they have, and nearly all cities will do worse than the national average, which is whiter than most large urban areas.
What to do? Matt Yglesias points us to a study from Kristin Blagg of the Urban Institute, who controlled for a whole bunch of factors1 and then produced “adjusted” scores for 23 different cities. (Spoiler alert: Boston is best, Detroit is worst.) That’s useful, but there’s an easier way to look at this—cruder, admittedly, but still useful: just look at the scores for a single ethnic group and see how they do in different cities. Here, for example, are the scores in 8th grade reading for black kids in our four biggest cities plus Washington DC:
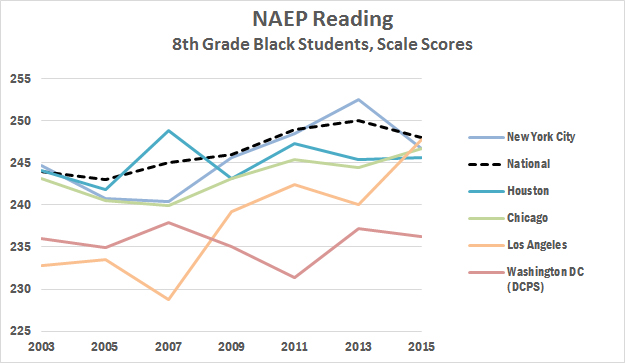
By 2015, all four of the biggest cities were doing about equally well, and they were all right around the national average. This suggests that the underlying quality of schooling is roughly average in all four. Washington DC, however, is an outlier. Black kids perform a full ten points worse than black kids in other cities. By the usual rule of thumb, that’s a full grade level.
But how about improvement? Here’s how scores have increased since 2003:
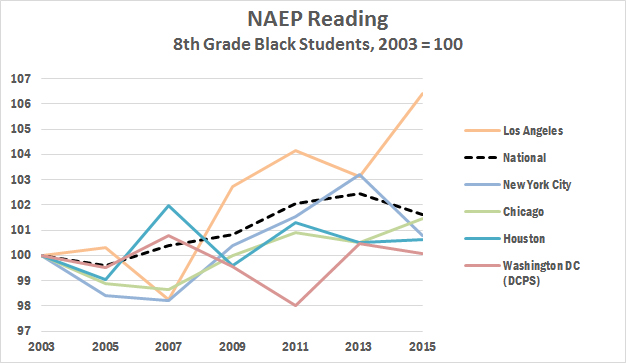
This time, the big outlier is Los Angeles, which has improved by about 6 percentage points. The others have all improved by about 1 percentage point—except for Washington DC again. Basically, the DC school district looks like a disaster. Its absolute quality is low and its rate of improvement is abysmal.
I picked this example more or less at random. You could look at math scores instead, or a combination of both math and reading. You could look at 4th grade scores. You could look at Hispanics or whites. I chose reading because I think it’s a better indicator of learning; 8th grade because later grades are more important than earlier grades; and blacks because there are big issues with well-off white kids self-selecting into private schools at different rates in different cities. If you want to look at things differently, the raw data is easily accessible, and it only takes a few minutes to turn it into a colorful chart.
Bottom line: If you live in New York, Los Angeles, Chicago, or Houston, your school district is probably OK. Not great, necessarily, and obviously there can be big differences from school to school. But contrary to conventional wisdom, it’s probably OK. Go ahead and send your kids to public school.
As for Washington DC, I don’t know what the deal is. But if you have the wherewithal, avoiding the public school system might be a good idea.
1Blagg controls for gender, race and ethnicity, eligibility for free and reduced-price lunch, limited English proficiency, special education status, age, whether the student was given a testing accommodation, the amount of English spoken at the student’s home, and the student’s family structure (e.g., two-parent, single-parent, and foster). This is obviously far more sophisticated than merely looking at a single ethnic group, as I’m doing. On the other hand, I confess to a vague unease with studies that try to control for so many variables, especially when a lot of them are collinear. But that’s just me.
On the other hand, income—and, in particular, concentrated poverty—are pretty important. Just looking at a single ethnic group doesn’t control for that. On the other hand, eligibility for the school lunch program is the only income proxy available, and as a measure of poverty it’s pretty lousy and getting lousier over time. We just don’t have a very good way of comparing levels of poverty between school districts.