How much has income inequality increased over the past few decades? This is a matter of some contention, and the answer can depend on things like what inflation rate you use; whether you correct for household size; whether you measure consumption or income; and estimates of non-cash income like health benefits. My preference has always been to look at income shares so the inflation rate doesn’t matter; personal income so household size doesn’t matter; income rather than consumption; and to include as much non-cash income as possible.
However, there’s always been another major critique of income numbers that has to do with technical changes made to tax laws in 1986. Dylan Matthews points to a recent paper on this subject:
What looks on paper like a big increase in inequality in the 1980s and onward, Auten and Splinter argue, is really just money being shuffled around in response to Ronald Reagan-era changes to tax law. In 1980, the top individual income tax rate was 69.13 percent; by 1989, it had fallen by more than half, to 28 percent.
In the 1960s and 1970s, companies usually reinvested their profits rather than giving raises to executives….Reinvesting the money ultimately benefited shareholders in the company by increasing the company’s value, and benefiting shareholders means benefiting rich people….After the tax cuts, companies started directing more money to raises. Rather than exploding actual inequality, Auten and Splinter write, the Reagan tax changes mostly shifted money that used to go to rich people through stocks so that it instead went to rich people in the form of salary.
This is a very technical argument that’s above my pay grade—though I’ll note that the wonks at the CBO don’t think it changes the overall numbers much. However, my own objection to it is fairly simple, and it might be wrong. But here it is anyway for public critique.
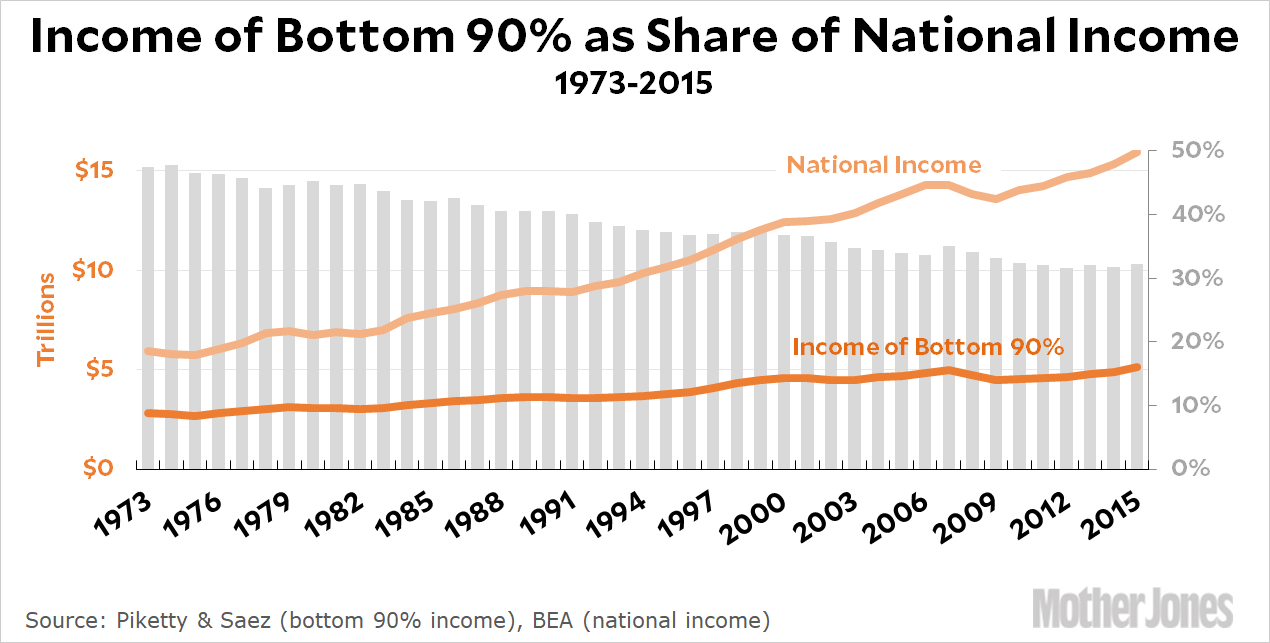
The famous income series from Piketty and Saez is the basis for most of these arguments. These are the figures that Auten and Splinter think are overstated. But their critique applies solely to rich people. Workers in, say, the bottom 90 percent never got much income from capital gains and therefore weren’t plausibly affected by the Reagan-era tax changes. If we look solely at this share of the population, here’s what it looks like:¹

Since 1973, the income share of the bottom 90 percent has declined from 47 percent to 32 percent. Obviously this means that the income share of the top 10 percent has increased from 53 percent to 68 percent. This is pretty consistent with an even bigger increase for the top 1 percent.
Don’t take the precise numbers in the chart too seriously—they’re probably a little low across the board—but I think they’re roughly in the right ballpark and show the correct trend. Basically, the idea here is that the income share of the non-rich is easier to measure since it’s mostly wage income and isn’t affected by tax law changes or capital gains measurements. Whatever’s left must be the income of the rich, one way or another. If you do this, the 90-10 measure of income inequality has increased from 113 percent to 213 percent since 1973. That’s a lot.
¹Since this is a tricky derivation, here are the details for data nerds. Income of the bottom 90 percent comes from Piketty & Saez here. Table_Incomegrowth has the income figures and Table A0 has the historical series of total tax units (roughly the same as number of households). I multiplied average income by 90 percent of total tax units to get total income for the bottom 90 percent. National income is here. Piketty & Saez use CPI-U-RS to create real income figures, so that’s what I used to deflate the national income numbers. (I spliced in chained PCE for 1973-77.) The share of total income for the bottom 90 percent is their real total income divided by real national income. The spreadsheet is here.


