<a href="http://www.goes.noaa.gov/browsh3.html">NOAA</a>
Click here for the latest updates on what’s happening with Hurricane Irene.
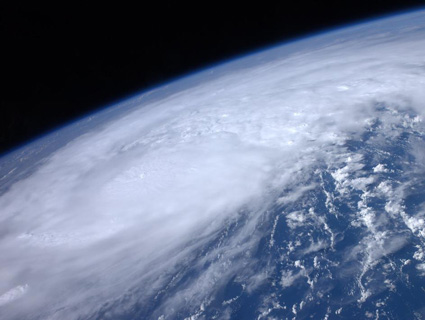
 Water vapor, showing massive footprint of Hurricane Irene at 1945 UTC on August 25. Credit: NOAA.
No matter where Hurricane Irene makes landfall it will likely impact a huge area of the East Coast. That’s because the storm is so huge—and it’s still growing—and because it’s so slow moving. These two factors amplify storm surge by inundating a lot of territory for a very long time.
 Crescent moon. Credit: NASA.Worse, Irene may well end up walloping the densely populated Northeast during the highest tides of the month—on Sunday’s new moon. If all the variables line up just wrong, this could lead to a catastrophic storm tide.
 Storm surge versus storm tide. Credit: NOAA.
Meteorologist Jeff Masters, writing at his Wunderblog, warns:
I am most concerned about the storm surge danger to North Carolina, Virginia, Maryland, Delaware, New Jersey, New York, and the rest of the New England coast. Irene is capable of inundating portions of the coast under 10-15 feet of water, to the highest storm surge depths ever recorded.
 animation from the 1938 New England hurricane. Credit: NOAA.") Historical SLOSH (Sea, Lake, and Overland Surge from Hurricanes) animation from the 1938 New England hurricane. Credit: NOAA.
Historical SLOSH (Sea, Lake, and Overland Surge from Hurricanes) animation from the 1938 New England hurricane. Credit: NOAA.
The 1938 New England hurricane (back in the days before naming), the only Cat 3 storm to hit the Northeast since the 1800s, drove a 15-foot storm surge onto Long Island.
Above, you can see the extent of that surge from New York to Cape Cod. Here‘s an animated simulation of that.
 Hand-drawn weather map of the 1938 hurricane. Credit: NOAA.
Masters estimates a 20 percent chance that Irene will deliver a storm surge higher than eight feet to New York City. If so, this is what it might look like, in his words:
SLOSH model predicts that a mid-strength Category 2 hurricane with 100-mph winds could drive a 15-20 foot storm surge to Manhattan, Queens, Kings, and up the Hudson River. JFK airport could be swamped, southern Manhattan would flood north to Canal Street, and a surge traveling westwards down Long Island Sound might breach the sea walls that protect La Guardia Airport. Many of the power plants that supply the city with electricity might be knocked out, or their docks to supply them with fuel destroyed. The more likely case of a Category 1 hurricane hitting at high tide would still be plenty dangerous, with waters reaching 8-12 feet above ground level in Lower Manhattan.
 Storm surge for a Category 3 hurricane. Credit: NOAA’s Storm Surge Interactive Risk Maps.
Here’s a storm surge map for a Category 3 hurricane that I generated with NOAA’s Interactive Risk Maps tool.
It’s a good idea to use that tool to take a look at your own risks if you’re anywhere along Irene’s flight path.
 Credit: Rhode Island National Guard.
Here you can see the storm surge damage from 1954’s Hurricane Carol in Westerly, Rhode Island. Buildings in the center of the photo were floated off their foundations. Buildings in the lower portion were swept completely away and only slabs and driveways remained.
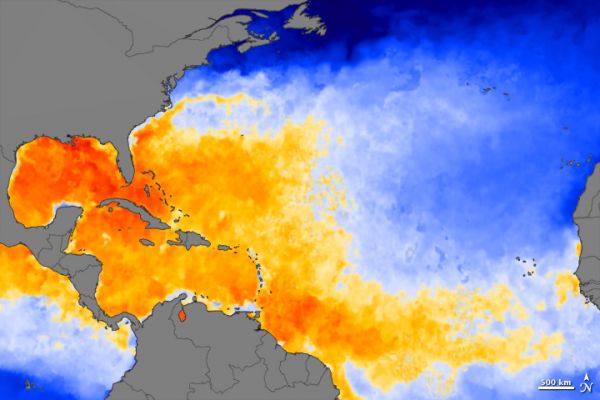
![]() Sea surface temperatures on August 23. Credit: NASA Earth Observatory.
Sea surface temperatures on August 23. Credit: NASA Earth Observatory.
To make matters worse, sea surface temperatures are running 1 to 3 degrees F above average between North Carolina and New York. Since warmer waters make for a wetter storm, Irene will likely manifest as a superwet double whammy: wet from intense rainfall, and wet from intense storm surge.
 Predicted rainfall from August 25 to 31. Credit: NOAA/NWS HPC.
This five-day precipitation forecast forewarns Irene’s real fury. Monster rainfall totals will likely lead to flooding of streams and rivers along much of the East Coast.
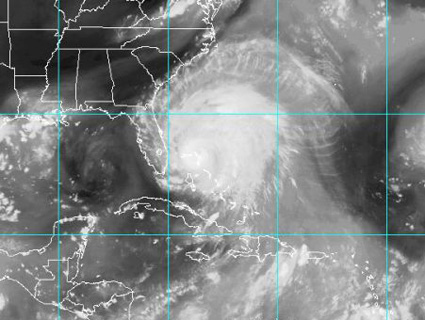
 Hurricane Irene at 22:45 UTC on August 25. Credit: NOAA/GOES Project Science.
Here’s what the storm’s grown to this afternoon.