
Record average national temperatures from May 2011 to April 2012: NOAA/NCDC
The last 12 months were the hottest 12 months in US history since record-keeping began in 1895. This according to NOAA’s National Climatic Data Center‘s latest State of the Climate report.
This historic heat broke the prior record set from November 1999 to October 2000 by 0.1°F.
 Ten warmest 12-month periods in contiguous US since 1895: NOAA/NCDC.
But what’s really interesting is if you put this new record in context of the current trend. As you can see in the chart above, all 10 of the hottest 12-year periods have occurred since 1999.
In the US, the 12 months between May 2011 and April 2012 ranked as:
- the 2nd warmest summer on record
- the 4th warmest winter on record
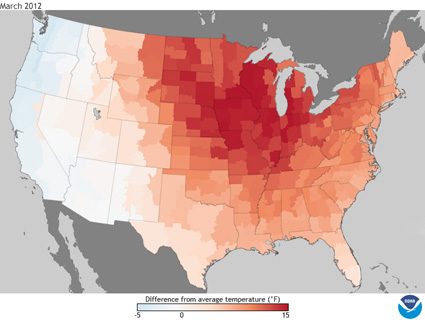
- the warmest March on record
- during this time 22 states saw record warmth
- during this time 19 states saw top 10 hottest
 Contiguous US temperature January-April 1895-2012: NOAA/NCDC
The average temperature in the contiguous US from January to April 2012 was of 45.4°F—that’s 5.4°F above the 20th-century average for that period. It shattered the prior record set in 2006 by a huge margin of 1.6°F.
The chart above shows the hot first quarter of 2012 charted against the long-term average since 1895. Specifically:
- The warming trend of 1.9°F per century is shown by the red line
- The long-term average can be seen in the gray line
- Actual temperatures from January to April 2012 are shown in the blue points/line
- The green line is a 9-point binomial filter, which shows decadal-scale variations.
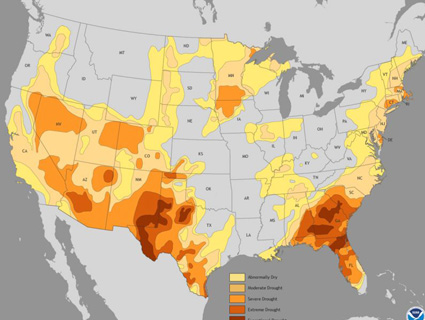
 United States Drought Monitor as of 1 May 2012.: climate.gov
The gnarly partner to all this heat is drought. The US Drought Monitor (USDM) map above shows the state of drought in the lower 48 as of 1 May 2012. That’s a lot of dry territory.
Drought is assessed on the D-scale (D0 to D4)—similar to the scale used for hurricanes and tornadoes—and designed to reflect the unusualness of a drought episode. D1 conditions (pale yellow) are expected to occur only ~10 to 20 percent of the time. Much-rarer D4 conditions are expected no more than every 50 years (darkest orange).

Heat anomalies central and eastern equatorial Pacific in past 12 months: NWS/Climate Prediction Center
One mastermind behind these temperature and drought anomalies in the US is the state of sea surface temperatures in the top ~1,000 feet (300 meters) of the equatorial Pacific Ocean. These reflect our current position in the El Niño/La Niña/Southern Oscillation (ENSO).
The strong La Niña that held sway for most of the last couple of years dissipated in April. The Climate Prediction Center forecasts a return to ENSO neutral conditions this summer—with a strong caveat that at least half the climate models predict a swing to El Niño.
But the ENSO pattern has been changing in recent years too (I wrote more about that here). So we really don’t know what’s in store, other than the likelihood—based on the trends—of more extremes and, with them, more costly weather and agricultural disasters.