<a href=http://www.shutterstock.com/pic-172074803/stock-photo-group-of-happy-graduates-throwing-graduation-hats-in-the-air-celebrating.html?src=74NWYXOf5u1bgxHsX2WUgA-1-0>michaeljung</a>/Shutterstock.com
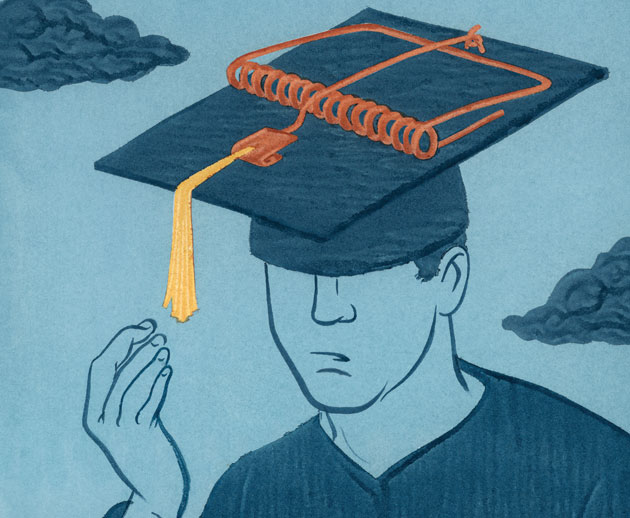
Student debt is an elephant in the room of the American economy. Total educational debt has ballooned from $840 billion in 2010 to more than $1.3 trillion this year, according to the Federal Reserve. And yet the Education Department has been reluctant to share data on the federal government’s student loan portfolio, meaning that, until recently, there has been very little detailed information available on the burgeoning crisis.
But now researchers are working to chart the extent of the crisis and its impact on communities around the country. An interactive map created by the Washington Center for Equitable Growth, a nonprofit research organization focusing on economic inequality, offers a glimpse into how the crisis is playing out across the United States.*
The main takeaway is simple and troubling: The prohibitive cost of higher education hits people of many backgrounds, in every state.
“Student debt is pervasive, no matter what your educational background is,” said Kavya Vaghul, an analyst who worked on the project. “There are effects across multiple groups.”
What is the extent of student debt in your city, or even in your zip code? Take a look below. You can toggle between different map layers using the menu at the top-right corner of the interactive.
Of course, the rich areas and poor ones have very different experiences of the crisis. People from low-income zip codes have lower loan balances but are much more likely to fall behind on payment. Those from high-income areas, by contrast, have higher loan balances and lower delinquency but also suffer long-term consequences from their debt loads.
The difficulty that many low-income individuals face in paying off student loans can be blamed in large part on the rise of predatory for-profit colleges, whose business models depend on students taking out large loans to finance educations that are often of dubious value. Several for-profit colleges have been caught lying about their job placement rates. Many students drop out, unable to sustain the cost of their education, but even those who complete their degrees find they do not command the salaries they had hoped for and fall behind on their student loan repayments.
These communities are also affected by poor access to credit, which can force low-income borrowers to take out more expensive loans from nontraditional lenders. Researchers view this trend as reminiscent of times when loans and other services were denied to borrowers in minority communities by banks and financial institutions—a now illegal practice known as “redlining.”
“We see this in communities that have been redlined throughout history,” Vaghul said.
Rich Americans, by comparison, are more likely to borrow for expensive graduate educations. This leaves them with higher loan balances, but they are also likely to have higher salaries post-graduation that allow them to pay off their loans over time.
This doesn’t mean they are getting off scot-free. Recent research has shown that student debt hurts borrowers’ ability to buy a home, delays marriage, and slows wealth accumulation. The bottom line of the student debt crisis? “High average loan balances really have these pernicious effects on the economic life-cycle,” Vaghul said.
This interactive, a project of the Washington Center for Equitable Growth with data made possible from Generation Progress and the Higher Ed, Not Debt partners, is built using Mapping Student Debt’s analysis of the autumn 2015 Experian student debt data and median income data from the 2013 American Community Survey. The maps were designed and developed by Pim Linders, Kavya Vaghul, Dave Evans, and Marshall Steinbaum.
Correction: An earlier version of this article incorrectly identified the Washington Center for Equitable Growth as a subsidiary of another organization. In fact it is an independent research center.


