
On Monday I posted a second look at homeownership among households under age 35. Ever since then I’ve been emailing with Gray Kimbrough to discuss various issues and to come up with solid data that goes back a long way. The reason for wanting a long time series is that homeownership goes up and down with recessions and bubbles and so forth, so it’s hard to pick any single year as a base value to compare with current homeownership rates. It’s better to simply look at the whole series.
As it turned out, Kimbrough was able to extract decadal census data going back to 1900, which I asked him to include in a chart. This is not because it sheds any light on current homeownership rates, but because I’ve never seen anything that goes so far back and I thought it would be interesting for its own sake. He kindly agreed, and his chart of the data is below. Note that I’ve added light dashed lines to the decadal data to make it a little easier to see.
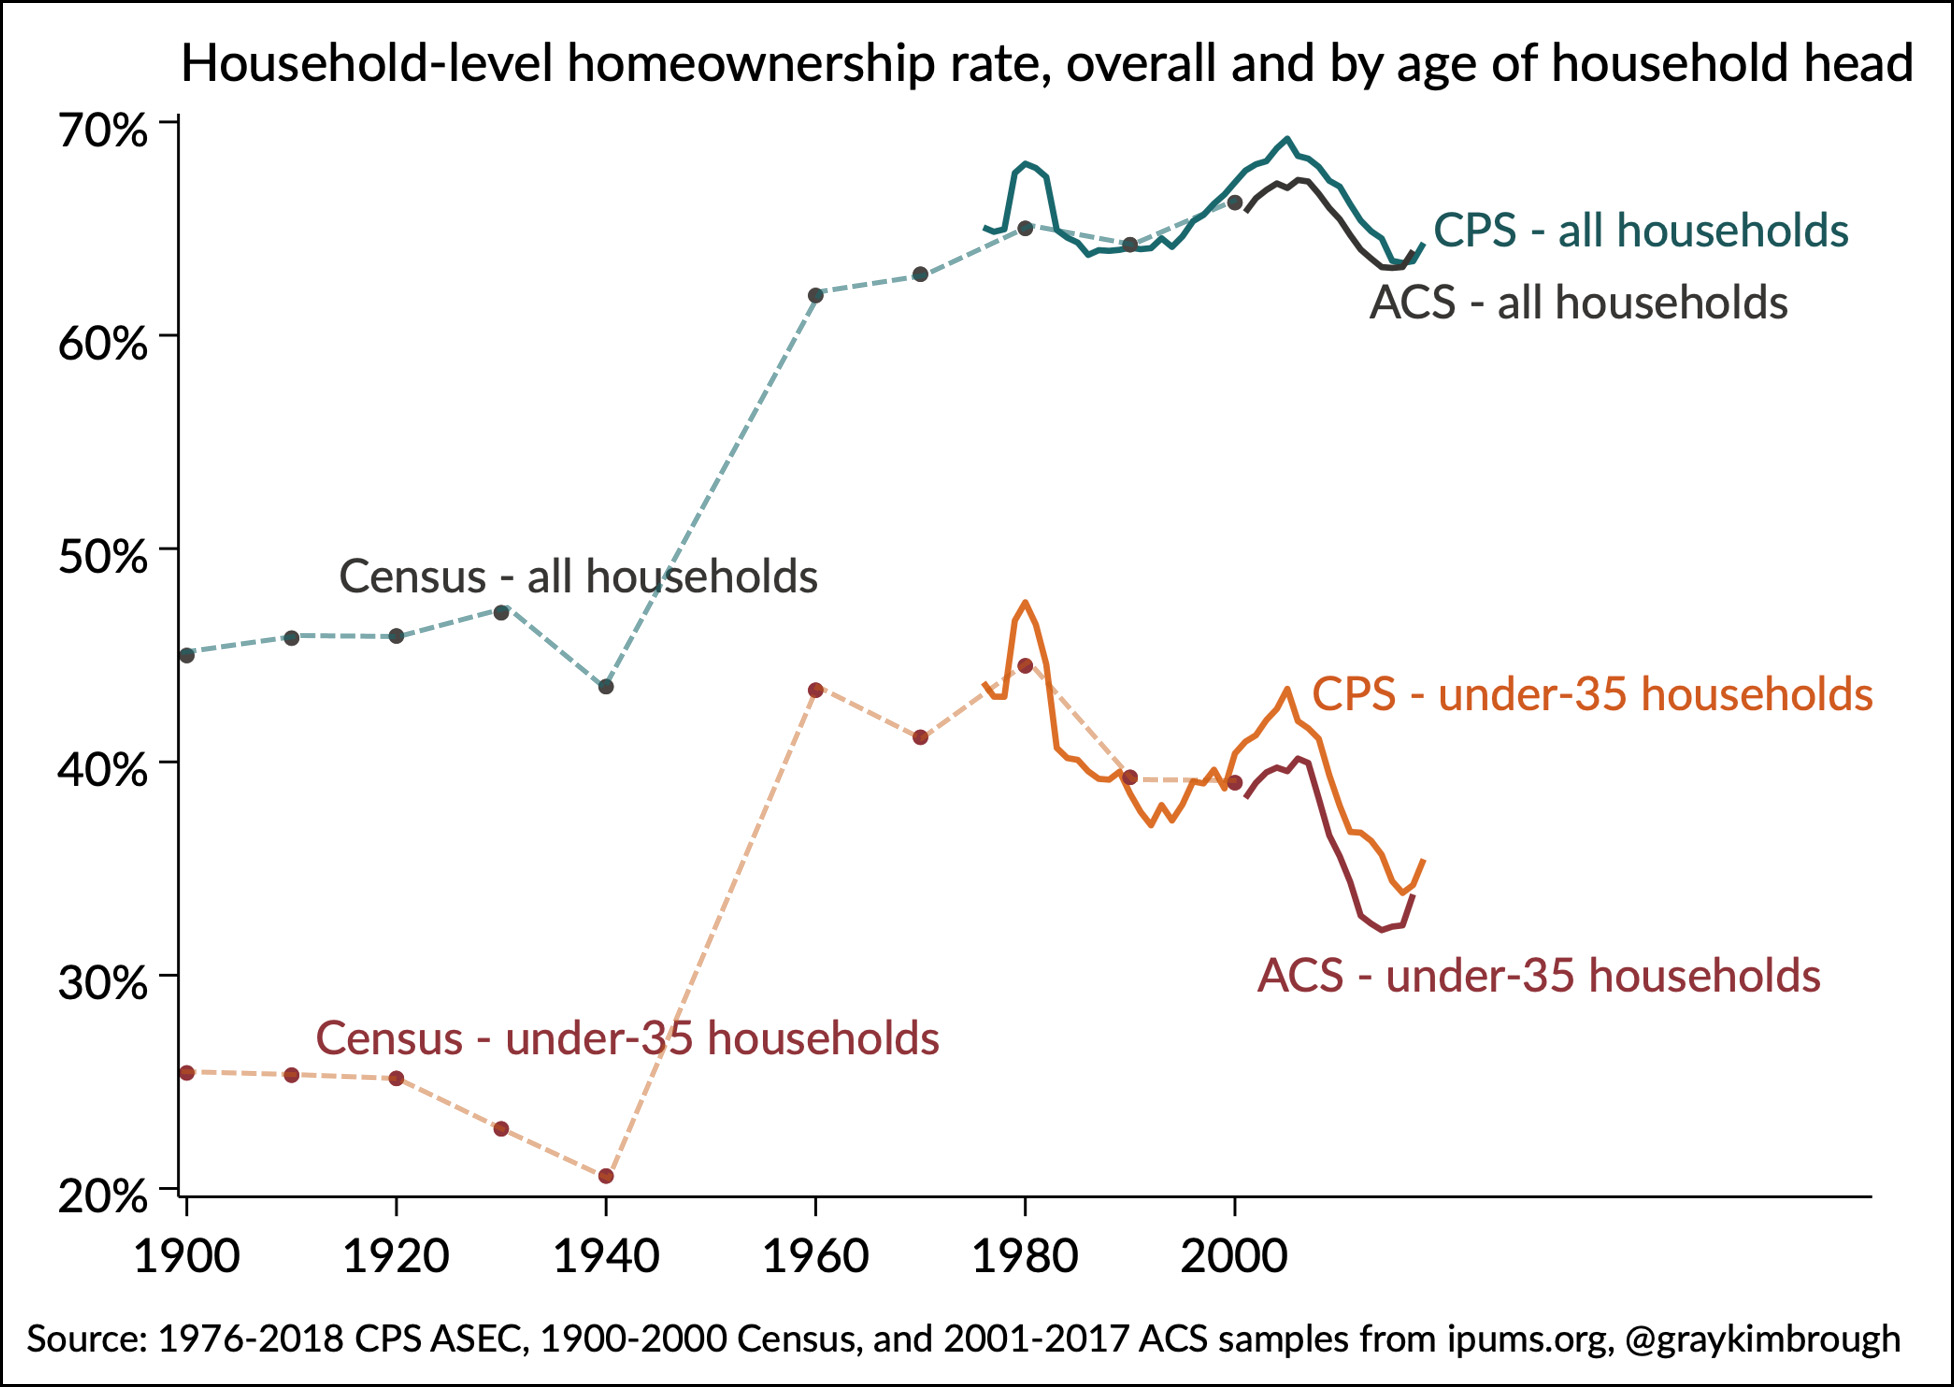
Looking at the postwar era (1960-2018), there are a few things to say:
- For overall homeownership, there’s a steady upward trend prior to the housing bust. For under-35s there’s a small downward trend. This divergence is most likely due to the long-term trend toward later household formation among the young.
- There’s a noticeable difference between the CPS data and the ACS/census data. I’m not sure which one is best, but the ACS uses a much larger sample size than the CPS, so I imagine it’s a less noisy series. Compared to CPS, ACS shows a much smaller increase in under-35 homeownership during the housing bubble and a much bigger drop during the bust.
- I originally used data from the Census Bureau’s annual tables of homeownership (Table 19 here), which shows that under-35 homeownership has gone from 37 percent in 1994 to 36 percent in 2019. In other words, young households have recovered almost entirely from the housing bust. This comes from the Census Bureau’s quarterly Housing Vacancies and Homeownership survey.
- However, both the CPS and ACS data in Kimbrough’s chart show something a bit different. The 1994 figure is still about 37 percent, but the 2017 ACS figure is a little under 34 percent and the 2018 CPS figure is a little over 35 percent. In other words, still several percentage points less than the 1994 figure. However, that’s probably gone up a point or two through 2019.
The upshot of all this is that it looks to me like the under-35 homeownership rate really has gone from about 37 percent in 1994 to 36 percent in 2019. However, 1994 turns out to be something of a low point, which is the whole reason I wanted to see a longer time series in the first place. If you look at the 1960-2010 data as a whole, under-35 homeownership appears to have declined from around 41 percent to 39 percent—and then it fell off a cliff during the Great Recession. Today it’s around 36 percent compared to a postwar average of around 40-41 percent. Conversely, the homeownership rate for all households is currently at about the same level as its pre-bubble average.
I’m really happy to see solid data for all this, and I want to thank Gray Kimbrough for working through it with me. He’s more than proved his point that millennial homeownership really was hit a lot harder by the Great Recession than other age groups.